Every few weeks, traders and investors alike brace for impact. Central banks (whether it’s the Fed or the ECB) step up to the mic to deliver interest rate decisions that could jolt the markets. But here’s something seasoned traders know: the charts often whisper before the officials speak. Long before the headlines drop, price action starts to shift. It’s not magic, but it’s the collective weight of positioning, sentiment, and anticipation baked into the candles. Sometimes, support levels quietly give way. Other times, volume builds beneath a breakout zone. The signals are there – if you’re paying attention!
Let’s break down how traders use chart setups to anticipate – not just react to – major central bank decisions.
Why Charts Matter Before Rate Decisions
Markets may be driven by fundamentals, but they don’t always wait around for official announcements. Traders, and especially big institutions, often try to get ahead of rate decisions by reading the room: watching inflation reports, economic trends, and, crucially, each other. That kind of crowd behaviour leaves a mark on the charts, often well before a central banker even steps up to speak.
That’s where technical analysis comes in. It helps traders pick up on the emotional “fingerprints” left behind in price action and volume. When a currency starts creeping above resistance or builds momentum with rising volume, it’s often a sign that the market is leaning one way – pricing in either a rate cut (dovish shift) or a hike (hawkish turn).
Take EUR/USD in early June 2025. In the days before the Fed meeting, the pair quietly climbed from around 1.1180 to above 1.1400. No policy change had happened yet – but the price action told a story. It hinted that traders were expecting softer inflation and betting on a potential rate cut by September.
What to Look for in the Charts
Before a central bank speaks, charts often begin to tell a story. One of the earliest signs? A breakout from a tight consolidation zone. If an asset has been trading sideways and suddenly bursts through resistance on strong volume, it usually means traders are placing early bets – anticipating a dovish signal, perhaps, in the case of a central bank preparing to cut rates. Take EUR/USD as an example: a move above 1.1450 ahead of a Fed meeting might reflect expectations of a softer tone.
Another clue is momentum divergence. Imagine price is climbing, but the Relative Strength Index (RSI) begins to flatten or even dip – that disconnect can be a red flag. It suggests buyers are running out of steam, or that traders are hedging against a hawkish surprise.
Volume adds further nuance. A rally with barely any trading activity behind it is suspect – it may be retail-driven or speculative. But if that same move is backed by rising volume, it’s more credible. It usually means the bigger players are positioning early, drawing on macro signals or institutional insight.
Then there are the classic fakeouts – moments when price briefly slips below support or pokes above resistance, only to snap back. These often appear just before big announcements when the market is nervous or divided. In those cases, a failed breakout tells you more about trader hesitation than about actual policy expectations.
A Case Study: EUR/USD Before the ECB
In early June 2025, just ahead of the ECB meeting, EUR/USD was knocking on the 1.1450 resistance level – a ceiling it had failed to clear several times before. The 50-day moving average had a healthy upward slope, and RSI hovered near 60 – pointing to steady bullish momentum, but without overbought pressure. Volume wasn’t explosive, but it was consistent.
Altogether, the chart painted a picture of quiet confidence. If the ECB even hinted at easing later in the year, traders looked ready to break that ceiling. But a more neutral tone from the central bank could just as easily send the pair sliding back toward the 1.1200–1.1250 zone.
EUR/USD YTD – Price, Moving Averages & RSI Leading into ECB June 2025
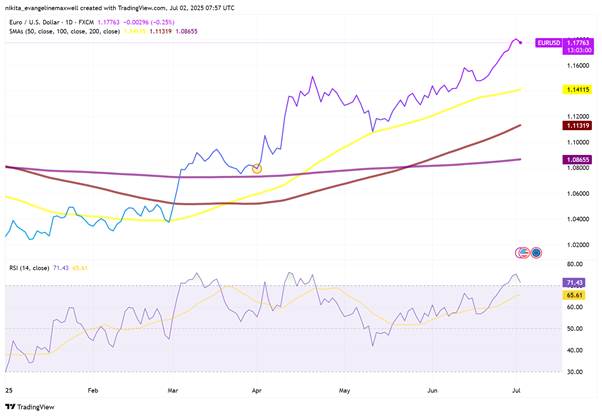
Source: TradingView. All indices are total return in US dollars. Past performance is not a reliable indicator of future performance. Data as of 2 July 2025.
Notice how price steadily climbs from the 1.11–1.12 range toward 1.1750 ahead of the ECB meeting. The 50-day SMA (yellow) slopes upward, and RSI pushes above 70 – showing bullish momentum. These technical signs hinted at rising expectations for a dovish ECB tone, even before the announcement.
Bottom Line
Technical analysis isn’t a crystal ball – it won’t predict exactly what Jerome Powell or Christine Lagarde will say. But it does give traders an edge by revealing how the market is positioned, what investors are expecting, and where potential risks might surface.
By paying attention to breakouts, volume trends, and momentum shifts like RSI – especially in the days leading up to central bank decisions – traders can often catch the market’s lean before the news hits. And in a year as uncertain as 2025, that kind of early signal can make all the difference.